Transcription of a lecture by Steve Wing, Three Mile Island epidemiologist, at the March 11-12 New York symposium sponsored by the Helen Caldicott Foundation
Steve Wing, Ph.D.
The Medical and Ecological Consequences of the Fukushima Nuclear Accident
The Helen Caldicott Foundation
March 11-12, 2013
Video archives
I think my title may be able to have been used by any of the speakers at this whole symposium. I wanted to pick something that I can fit into, but a little bit more specifically I would like to talk about how we approach estimating health impacts of radiation releases from nuclear facilities.
And there are two general approaches which you already heard about. I want to identify them and their logical bases and compare them. One approach is risk assessment. That means that we use some estimates of dose and we multiply the estimates of dose to people by some dose-response curve which gives us the estimated number of effects, number of events, or cases of disease for each amount of dose. And the other method is epidemiology, which means that there is some kind of surveillance for disease. And we look at the differences in the rates of disease between exposed and unexposed populations.
So I want to begin with talking about risk estimation or projection and this may be obvious, but I think it’s worth noting or repeating something that we all know is that “Randomized human experiments, looking at the long-term consequences of exposure to various forms of ionizing radiation, are not possible.” So we can’t conduct experiments. We can’t conduct human experiments. So we have to either extrapolate from cellular or animal studies, or conduct non-randomized human studies which are epidemiologic studies. And both of these approaches suffer from problems of bias and selection; measurement errors and selection, which of course experiments also suffer from biases, but we won’t go into that today.
So just recently this document came out of the World Health Organization, and it’s already been referred to, most recently by Ian Fairlie.
And it is a risk assessment or risk estimation. It is based on the dose estimates produced in a previous report last year on Fukushima.
It’s also based on data from the Life Span Study of A-bomb survivors, which you heard about and you will hear about more in just a moment. This dose assessment I want to emphasize just a few of the things Ian Fairlie already has said is that there are a number of components of the doses that are ignored. The committee chose not to assess doses within 20 km of Fukushima nuclear plant. They chose not to assess the radioactive gases such as xenon. They did not assess fetal doses. And I think Dr. Wertelecki has already given us a great introduction to why we might care very much about the fetal doses.
What I want to start out is talking about the Lifespan studies. I am going to show you a little bit of the information that has been around for a long time from a volume that came out in the 1970s as well as very recent information that has just appeared within the last 90 days from Radiation Effects Research Foundation and from our group at University of North Carolina.
These graphs show the immediate casualties at Hiroshima and Nagasaki in relation to the distance from the hypocenters of the atomic explosions.
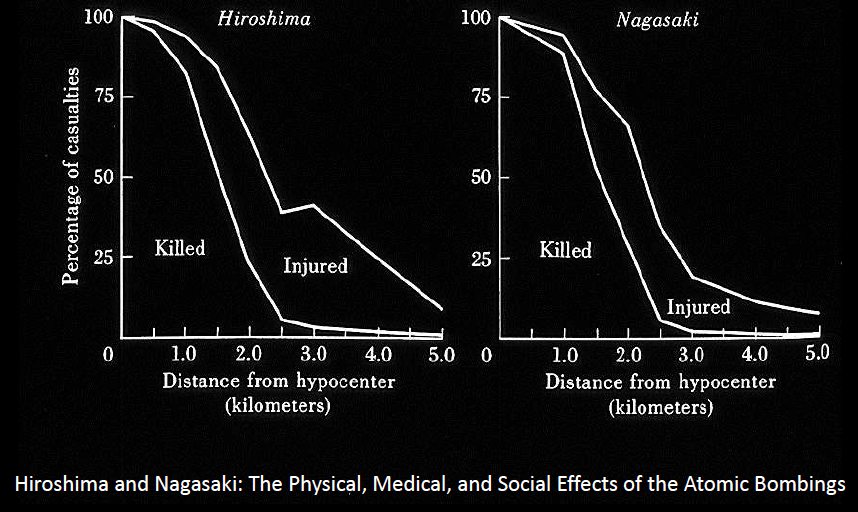
And I want to make the point that the study upon which all our risk estimates are based did not begin until more than five years after the bombings, and many people did not survive to be in the study. If mortality from the immediate effects of the bombings is related at all to frailty and to longer-term risk, there would have been a harvesting of the most radiosensitive from this population. It’s a very important thing to remember, especially because of the destruction of the physical infrastructure of these cities, food supplies, water supplies, hospitals, Hiroshima was hit by a typhoon, so there are lots of forces selecting for healthier people.
I also would note that the study of cancer incidence, which you already heard about in this symposium, did not begin until 1958. So any estimates of cancers following exposure to radiation based on the LSS, cancer incidence, omit all cancers that occurred within 13 years of exposure. And we know from many other studies that lots of cancers occur in less time than that. And this is something that is routinely omitted when risk estimates from the LSS are applied to the populations including the population of Fukushima and the population of Japan. And especially important in the shorter-term effects are the impacts of in-utero exposure and also shorter-latency cancers such as leukemia and lung cancers.
Now a few other, uh, a little bit more information from the 1970s volume on the Physical, Medical and Social Effects of the Atomic Bombings. This is the depiction of the radiation from the atomic bombing of Nagasaki.
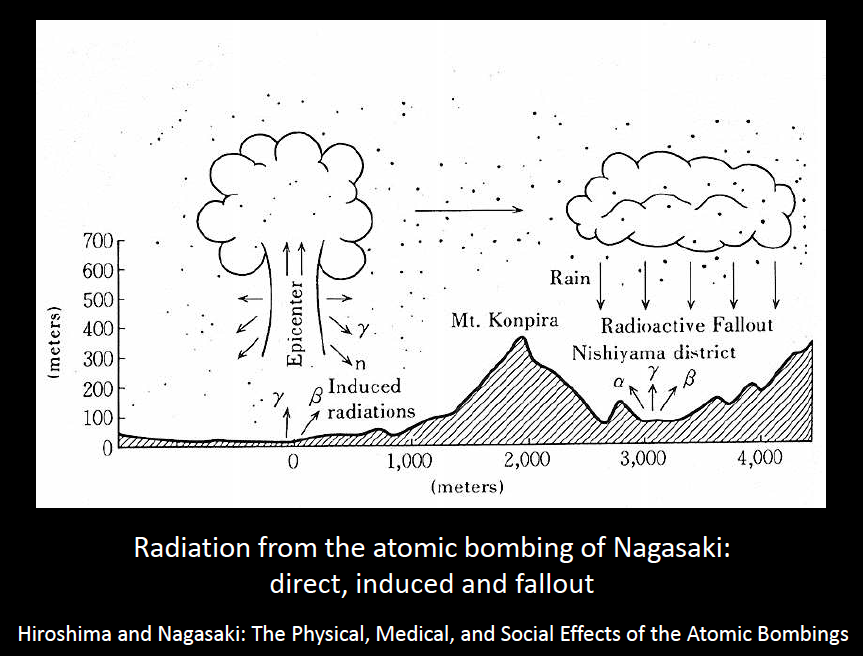
We have the epicenter or hypocenter, and gamma and neutron radiations coming from the blast, all of which were gone within seconds. But there are other sources of radiation as depicted by the arrows coming from the ground below the blast, gamma and beta induced radiation from neutron activation. And then here in the Nishiyama District, a particular radioactive fallout. Now the RERF, which is responsible for the A-bomb studies, has chosen not to estimate any of the radiation doses due to these two other sources, residual radiation being composed of either induced radiation or fallout.
Fallout was also a problem in Hiroshima. You can see in this map the drawings of where the fallout, so-called Black Rain, came in Hiroshima.
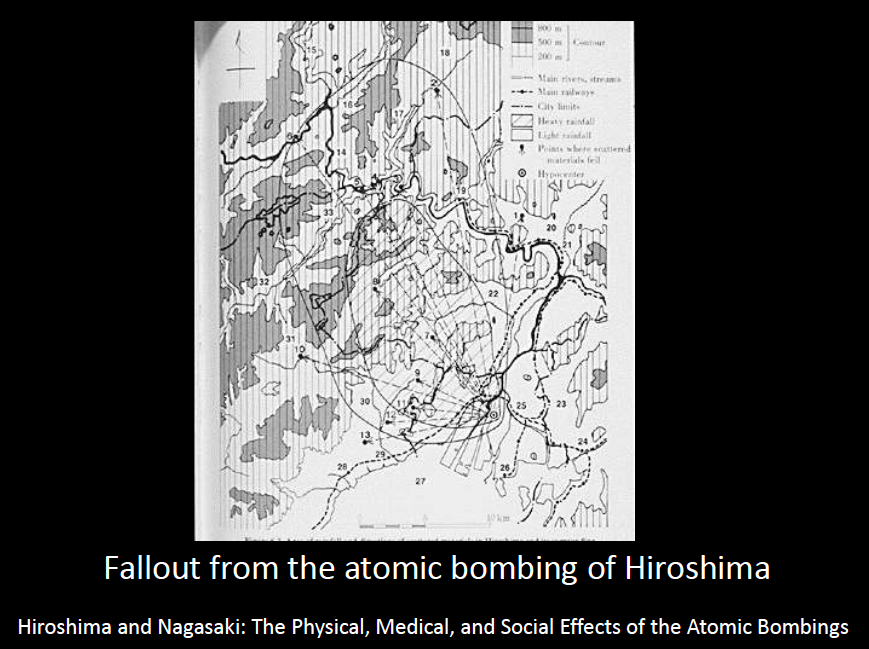
Note that in both of these depictions, the fallout is not primarily at the hypocenter. Who is more affected here? People who live at some distance. So this is important in the epidemiologic study because it means that the fallout is disproportionately affecting people with the lowest doses directly from gamma and neutron blasts.
What happened after the blasts? Who was near the ground zero?
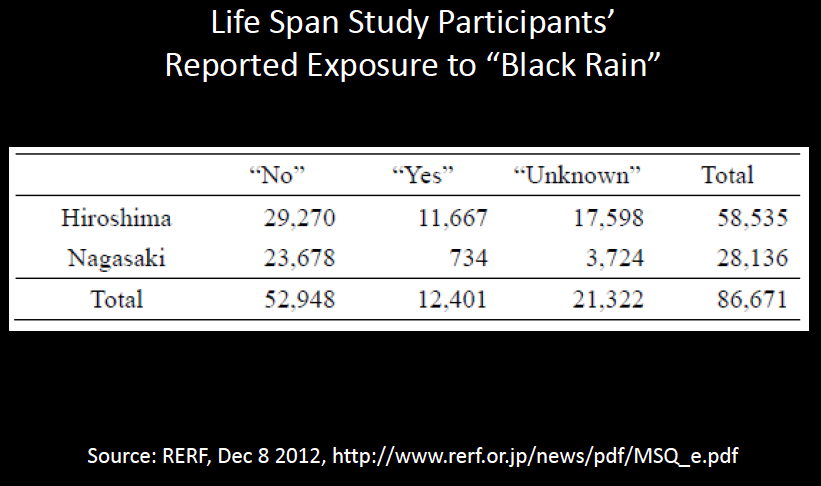
Oh, first let me finish with the fallout, the Black Rain. So this report just came out in December from the RERF. And they asked people about exposure to the Black Rain. They asked the survivors. And of the 86,671 survivors in the primary analyses, they give us our risk estimates, 12,000 approximately said “Yes,” but over 21,000 there is no information. This is something I want to emphasize is that the lack of data, missing data, is a big problem in the LSS, that could be investigated more but has been ignored for a half century.
RERF has also reported this December on the mortality rates between 1950 and 2003, on the left, and between 1962 and 2003, on the right, in Hiroshima and Nagasaki.
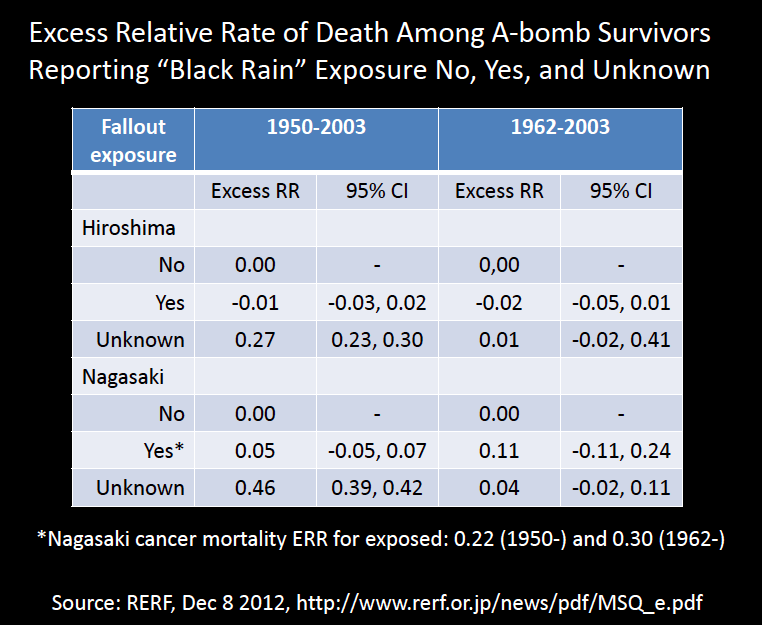
And the Excess RR which zero indicates the referent group that’s not exposed to fallout, that the group reporting exposure to Black Rain in both cities has no difference in mortality over either time period. But the unknown group in both cities have an excess mortality. It’s 27% in Hiroshima and 46% in Nagasaki. And if you look at the difference between 1950 to 2003, those estimates I just cited, there is basically no difference in the period 1962 to 2003. This means that during the period 1950 and 1962, there was a very large excess mortality among people who provided no information on their exposure to Black Rain. And that’s a very important time period that I will come back to in a minute.
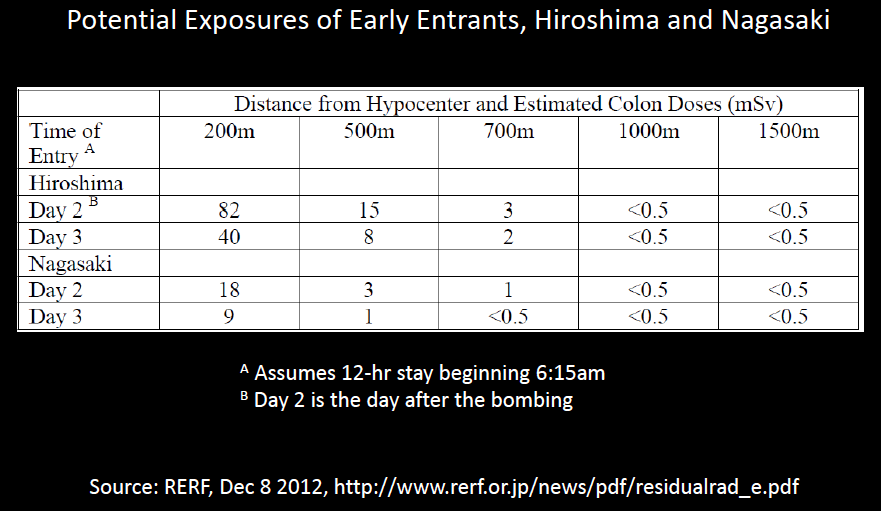
Now let’s talk about the early entrants, the people who could have been exposed to induced radiation near the hypocenter. Here are some dose estimated for Days 2 and 3, for people who had spent 12 hours from RERF. We don’t have any estimates for them from Day 1, but we know that induced radiation fell off very rapidly.
These are photographs from Yosuka Yamahata, taken the day after the bombing of Nagasaki.
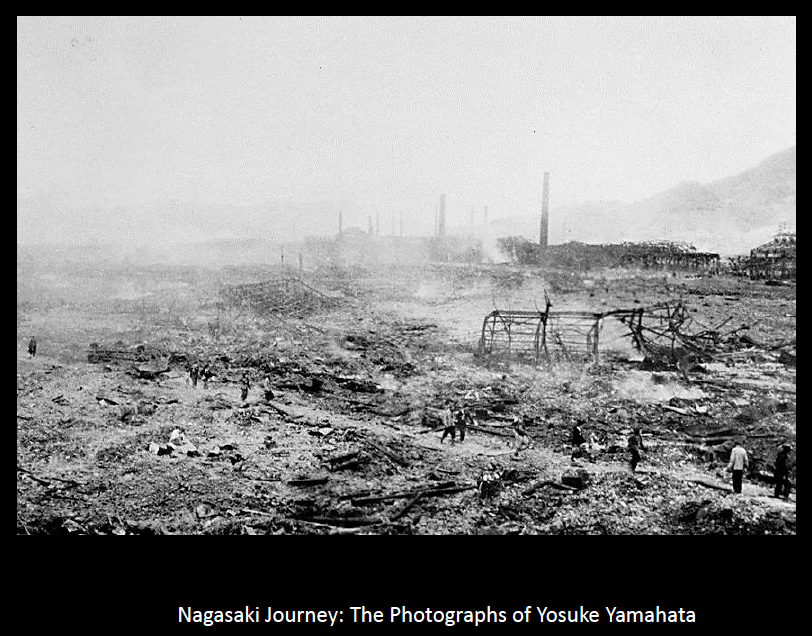

And what I want you to notice is that people are there. And these are not the people who were exposed to the hypocenter. These are people who are coming in from other areas. They are going through the city. Some of them are looking for their relatives.
When I was in Nagasaki, I had the opportunity to tour the museum there with a survivor who knew the woman on the left, on the right side of this photograph and explained to me that she was still living. This was just about five years ago. And in this photograph she found her mother.
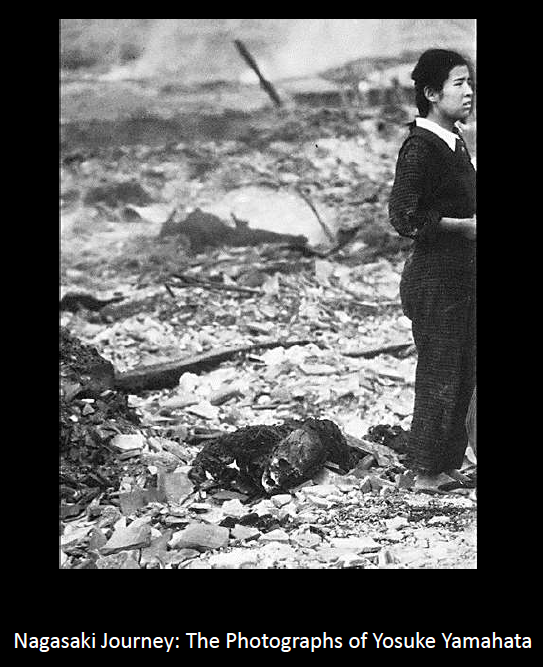
But people were there. And they were not the people who were most exposed to the blast. They tended to be people who were from farther away. So that’s a differential exposure again to the type of radiation that’s not counted in the Life Span Study.
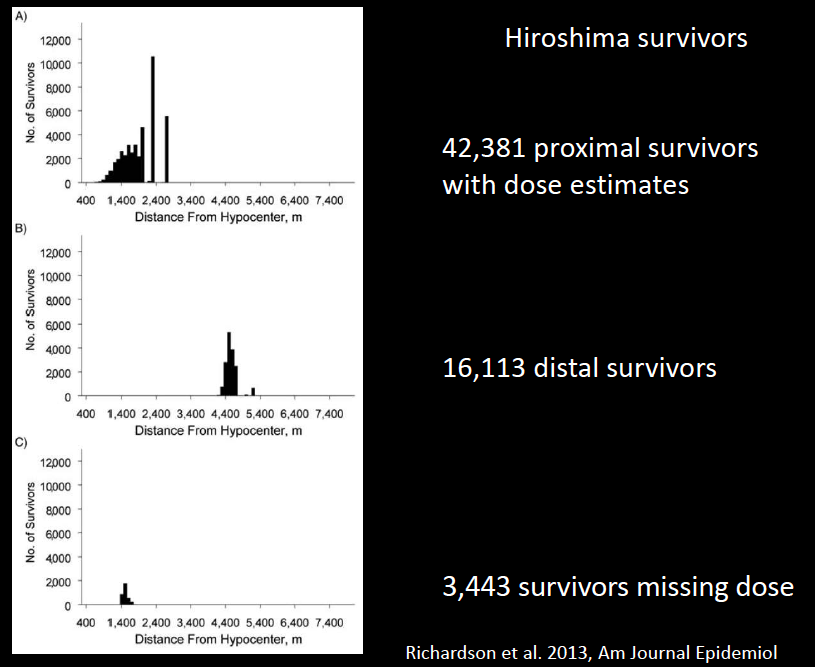
And the next few slides I want to share from our group at University of North Carolina.
What they show for Hiroshima and Nagasaki are the distances from Hypocenter of three groups of people: the proximal survivors in the first panel; the distant survivors in the second panel; and the survivors with missing dose in the third panel. And you can see that only proximal survivors can have missing dose. That’s because the RERF did not require detailed interviews with distal survivors to produce the dose estimate. They were all assigned the lowest dosing category. This forces a relationship between missing dose and exposure. You can only have a missing dose if you are exposed. Here’s the same situation that occurs in Nagasaki.
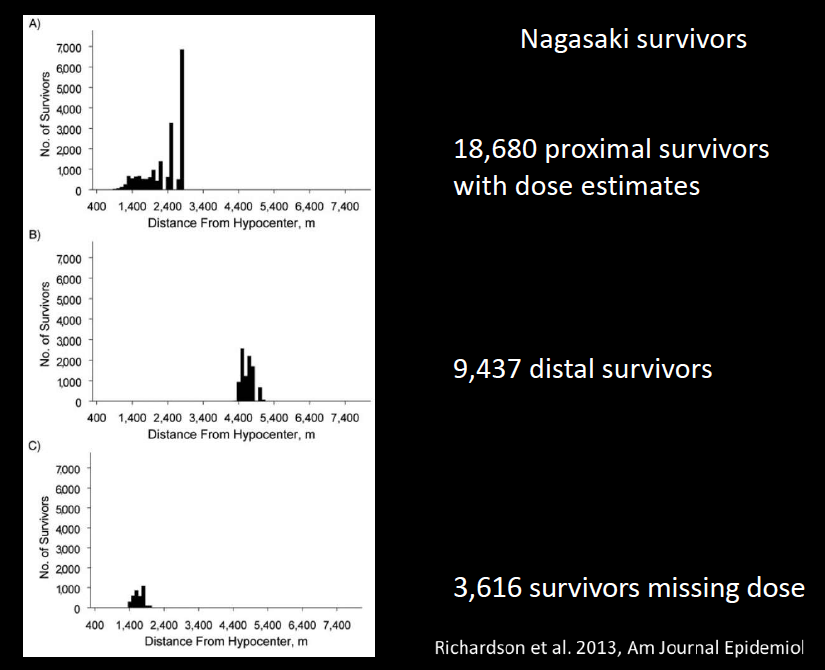
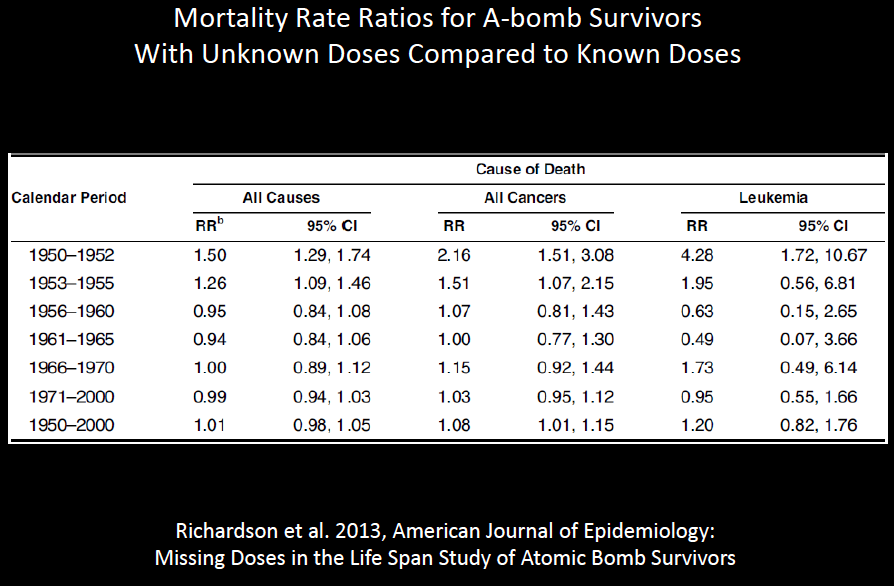
Now what does it mean in terms of the Life Span Study? This table shows us that in the 1950s, there were higher rates of mortality among survivors of unknown doses from all causes, from all cancers and from leukemia. So here we are taking out of the high-dose group, people with high mortality rates. What does that to the dose response estimates, if we remove the high mortality individuals from the groups with higher doses? I think it’s obvious.
So let me move on. And first remind you, oh, I must mention one other thing about this period between 1950 and early 1960s. In 1950, all survivors were entered into a follow-up on October 1, 1950. However, all survivors had not completed sufficient interviews to be assigned a dose at that time. Interviews needed to assign a dose continued until 1965. Yet RERF in all their analyses to estimate these risk coefficients that are applied to populations around the world, have entered people on October 1, 1950, who could not be in the study until later. It’s a phenomenon that an epidemiologist calls, “immortal person time.” What this does is, it inflates the denominator of the rates, of the cancer rates for the proximal survivors. So this is another phenomenon that causes an underestimate of the cancer rates for the proximal survivors. So we have another source of bias. I am not aware if this has been written about, but you can find it in our recent paper in the American Journal of Epidemiology.
Now, there are a couple of other things to say about the Life Span Study. We don’t have information about the carcinogenic effects of in-utero exposures, which are clearly and very important. The embryo and fetus are much more sensitive to carcinogenic effects of radiation, probably much more so than the children. But the Life Span Study doesn’t give us information on that at all. And therefore that effect is left out of many of the dose estimates that we typically see.
So now I want to talk quickly about four epidemiologic studies. My message here is what is projected based on the Life Span Study of A-bomb survivors, and what has been seen in epidemiologic studies.
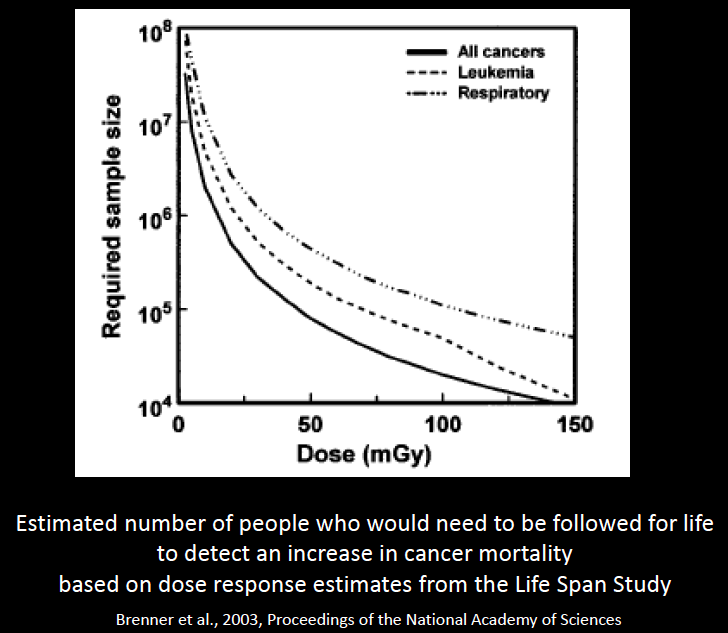
This is a graph from David Brenner who spoke yesterday on estimated number of people who would need to be followed for life to detect an increase in cancer mortality based on the Life Span Study estimates. And you can see that at low doses under 50 mGy or so, we are talking about 100’s of thousands to millions of people, according to these estimates.
So I learned about this first when I started working on radiation in 1998 when I was assigned to lead the study of the mortality in workers from the Oakridge National Laboratory whose radiation doses had been monitored from very early on with individual badges.
You can see here workers putting their radiation meters in proper boxes.
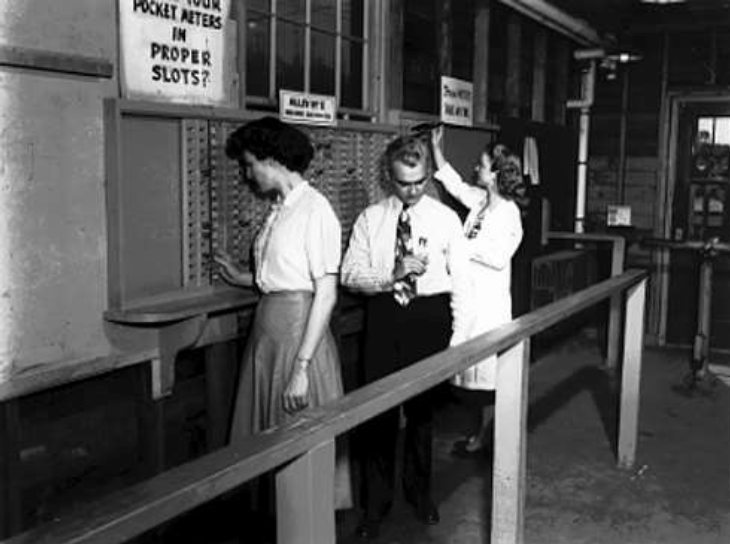
And I was told we would not find any effect of radiation in this population because it was too small and the doses were too low. So my first encounter with the dominant wisdom in this field was when we found that, only after about 20 years latency, we were seeing dose response relationships: the higher the readings in the badges, the higher the cancer rates in the workers.
But this was impossible, I was told.
Chernobyl, you heard a great deal about. I want to call your attention to this passage from a 1991 document, five years years after the accident, by IAEA, International Atomic Energy Agency. “On the basis of the doses estimated by the Project teams and currently accepted radiation risk estimates, future increases over the natural incidence of cancers or hereditary effects would be difficult to discern, even with large and well designed long term epidemiological studies.”
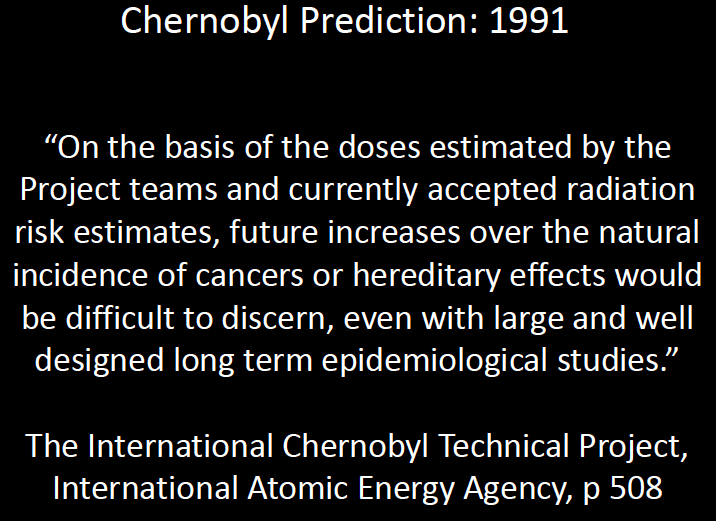
And you’ve seen a plethora of information today and yesterday, that this turned out not to be so.
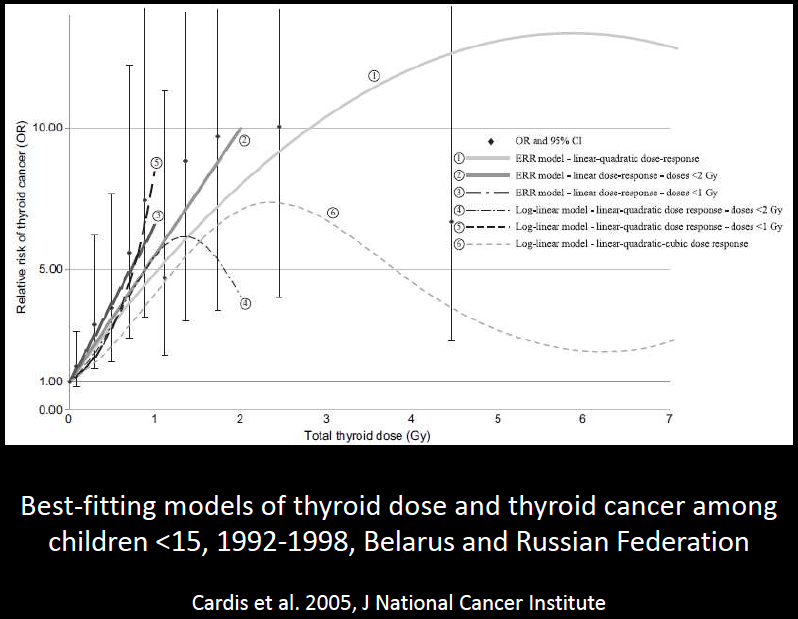
This is one graph, I won’t dwell on it, from a thyroid cancer study which has individual dose estimates including information from thyroid scans.
Another nuclear event where we were told there were no cancer effects possible was the Three Mile Island nuclear accident in 1979. I have just a few photos here from Bob Del Tredici’s book, The People of Three Mile Island, to give you a sense of what the area was like in 1979.
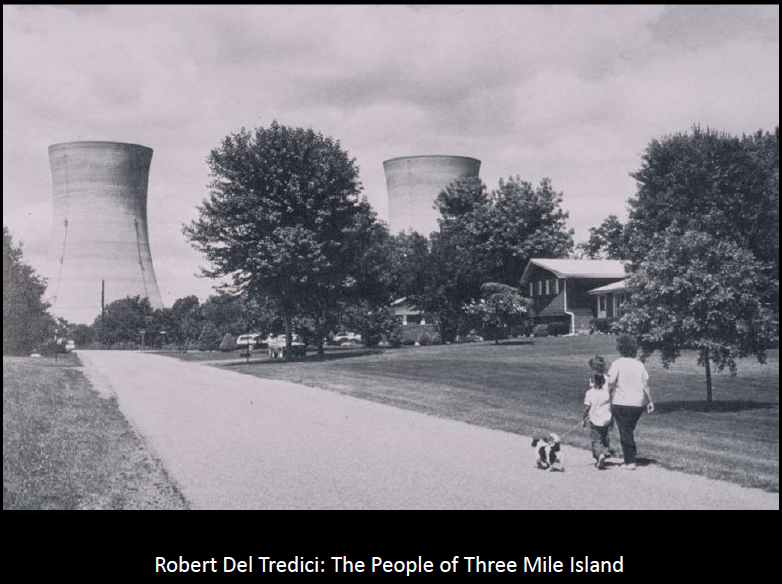
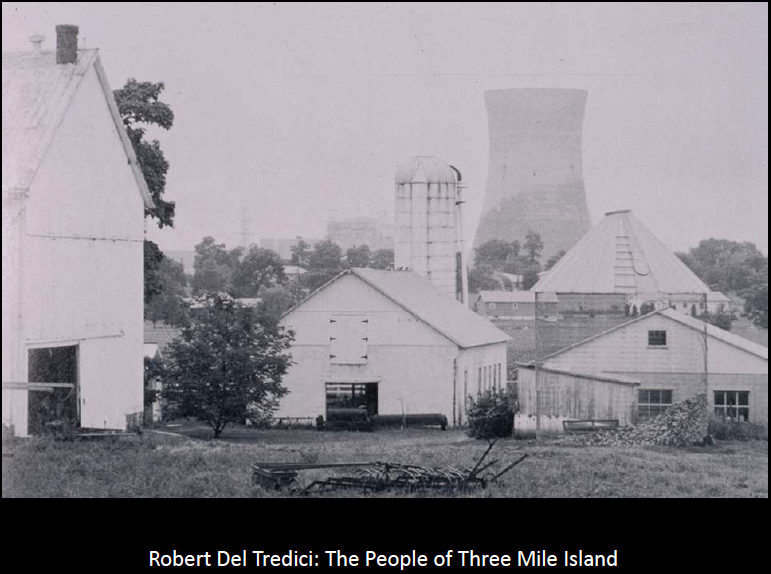
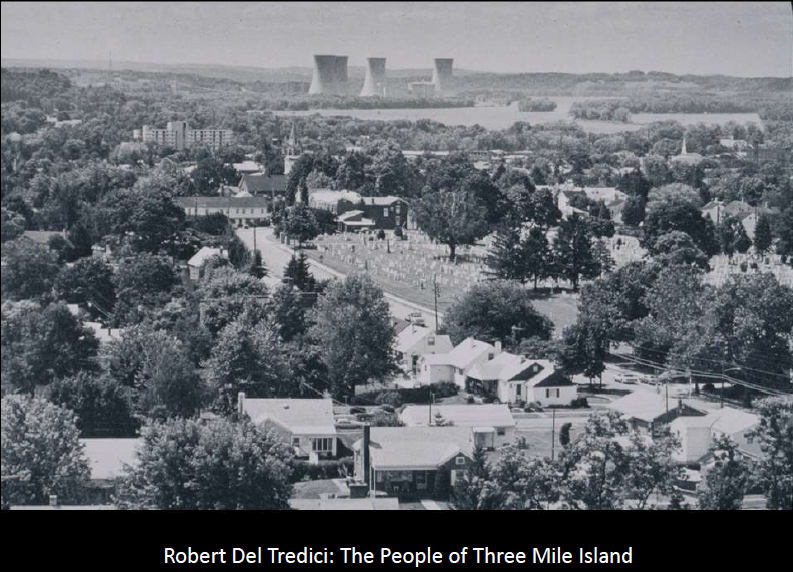
People lived quite close to the plant. Many reported the symptoms such as reddening of the skin, deaths of pets and animals, nausea and vomiting, and hair loss, and they were told that this was due to stress. Now, I started working on this because of lawsuit involving several thousand people, and I first did look into stress.
I think stress is very important and I am sure the people of the TMI were under tremendous amounts of stress. However my assessment of medical literature was their reports did not fit the scenario of stress-induced acute effects, sometimes called mass hysteria in medical literature.
So we conducted a reanalysis of data on cancer incidence that were collected from local hospitals during the period 1975 to 85, and the dose estimates made by the investigators, and we found, and I want to point out one thing is that this study was designed to avoid a problem that’s a big concern in any well-publicized event, which is that there is detection bias. People report sooner, they get more diagnostic tests. So we expect there to be an effect of detection bias on the disease incidence rate following an event like this. Everyone in this study was within 10 miles. They were all exposed to the same detection bias.
This is a graph showing our results. Radiation levels in the area are shown from very low in the green to high in deep red, and bars indicate relative rates of lung cancer which occurred between two and seven years after the event. And what’s very clear is that the lung cancer incidence rates rose dramatically in the direction of the plumes where the plumes from the emissions were estimated to have traveled in the first days of the accident.
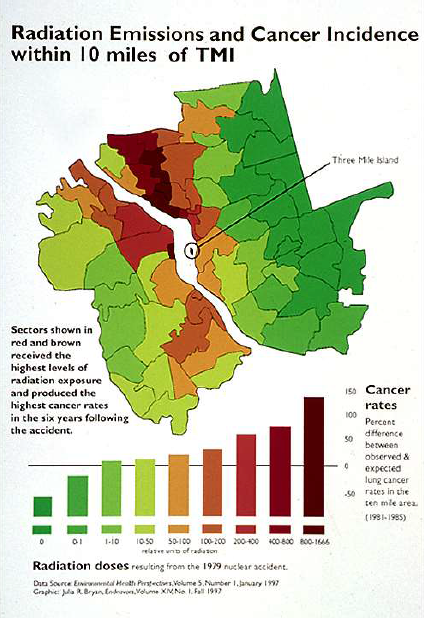
Again, the risk projections said there would be no effects.
Next I want to mention studies of routinely operating NPP, which is the topic of the current interest in the National Academy of Science. Tim Mousseau who spoke yesterday has been on their panel. This is also a situation where the projection is that no cancers will be observed among people who were exposed to routinely operating reactors.
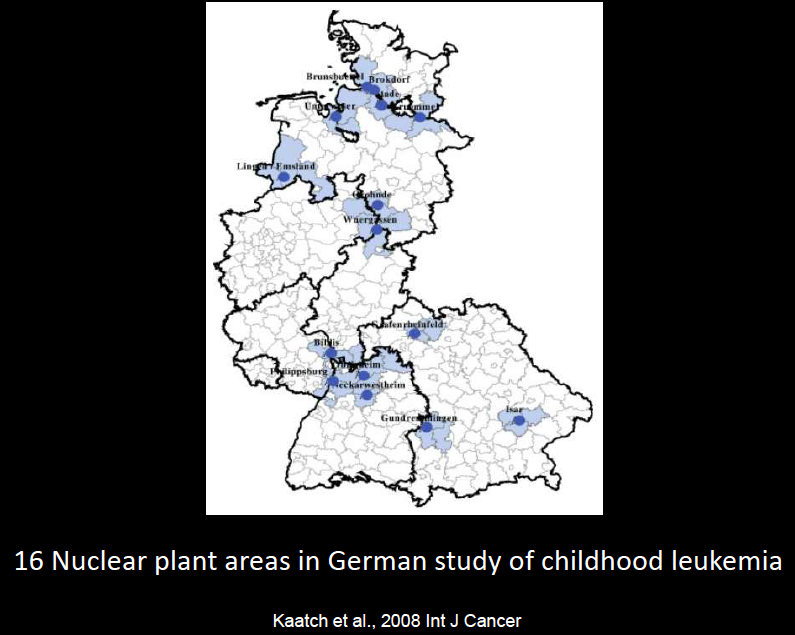
So studies like European studies have never been done in the U.S. I brought one example of a study of childhood leukemia in Germany. These are the study areas around the 16 nuclear plants.
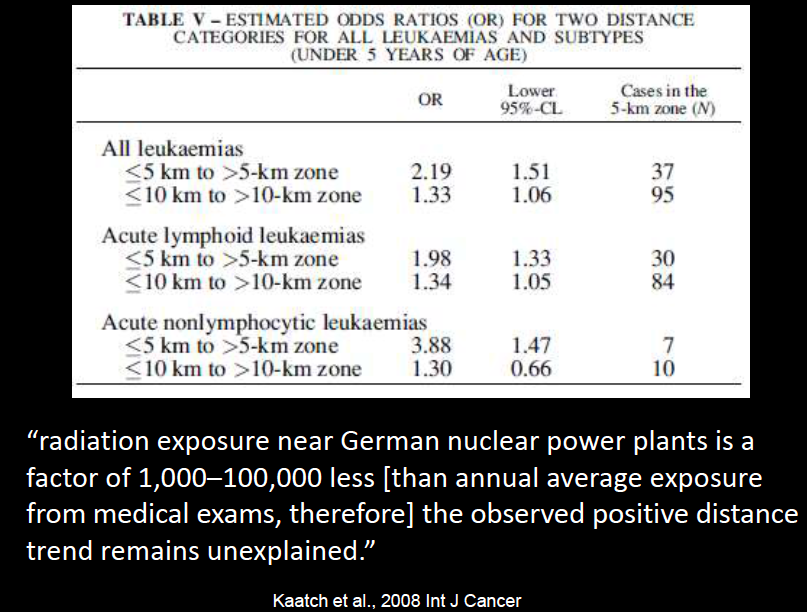
This table shows that in the 0 to 5 age group, the rate ratio, relative risk or odds ratio, all equivalent here, in the 0 to 5 km zone, it’s more than a doubling of childhood leukemia incidence in these areas collectively, compared to the areas that are further away. In each case the comparison group is not from some other place. They are also in the same areas, cases and controls in the study. So the authors conclude, “radiation exposure near German nuclear power plants is a factor of 1,000 to 100,000 times less [than annual average exposure from medical exams, therefore] the observed positive distance trends remain unexplained.”
And I feel that I’m repeating in some ways what we heard this morning from Dr. Wertelecki, that we are not able to conclude anything from studies that have been done because they don’t comport with the projections from the A-bomb survivor studies.
Yesterday Dr. Brenner compared the radiation risks to deaths from violence and earthquake and tsunami in Fukushima. And I think he has a point.
But I would ask the question, what’s the difference between these, energy generation and medical irradiation for that matter. Energy generation is highly profitable. And it’s a public decision made by politicians who are in many cases tied to nuclear companies and weapons contractors that created the nuclear energy industry in the first place. There has been a discussion of public education, and I would argue, yes, we need public education. Not only about radiation but about science and about civic life, because our science is affected by our political system.
In Fukushima, there will be extra challenges to epidemiologic studies when we compare the situation to the others I mentioned today and have been mentioned here earlier. And some of those challenges involve the fact that there was an earthquake and the tsunami. And there were huge disruptions of living conditions. There was a lot of relocation. People were moving around,
Estimating doses for individuals, which is important and critical in epidemiological studies, will be made very much more difficult. Ian Fairlie showed just recently time trends in infant mortality, and we could look for other time trends. Let’s remember that the radiation was not the only thing going on that was different after this event. People were moving, they were relocating, their diets were affected, their medical services were affected, and people died. Many, many thousands of people died. This is all going on at the same time, and it’s going to be difficult to separate out the radiation effects from this.
One of the things I think is very important is that there are risks from conducting research. Some research can be designed in such a way that it is unable to detect an effect even if the effect is there. This is something that the exposed populations need to understand. Because if they come to count on science to help them, they need to know science isn’t perfect and it’s never done in perfect conditions.
There were also comments yesterday and earlier today about biases and objectivity in science.
I would like to leave you with the idea that the main threat here is the lack of critical thinking, and this includes self-critical thinking.
In this area that we are interested in here at this symposium is that one primary problem is the failure to question authority. And that is a great example to me is the Life Span Study, which is applied all the time, every day, from legal situations to workers compensations, to estimating health effects of the Fukushima event. And authority is very important because authorities control access to jobs, to research funding, professional meetings and journals. Tim Mousseau talked about this yesterday.
What we are trying to do is very difficult. It’s not easy. But as we proceed to get more information on the effects of Fukushima to learn more about the population impacts, one of the things that I would ask is that we not confuse narrowly constructed research hypotheses, meaning that there would be an excess of some condition in exposed population, let’s not confuse that with systemic analyses that we are also interested in.
Things like, “Is nuclear power a good policy?”
That’s a different question.
If nuclear power is a bad policy, it doesn’t mean that every study has to find an excess cancer.
That’s a different question.
So, with that I will thank you for your attention and maybe talk to you later.


2 comments:
This is great. Thanks for the transcription of a great presentation. One suggestion for a correction: cancer "incidents" should be spelled "incidence."
Thanks for pointing out my typos. Corrections have been made.
Post a Comment